RPI group partner Ejlskov was tapped for an active gas station remediation project. Trap and Treat® BOS 200® was applied at an active gas station in Europe with elevated dissolved phase contamination and NAPL impacts to protect the primary aquifer and cut off the dissolved phase plume from migrating off-site. Over the course of 4.5 years of monitoring, 92.4-99.9% reductions in Benzene were achieved in the treatment area (replaced) monitoring wells. Validation soil samples collected 36 months post-injection indicate clear evidence of total mass reduction.
Project Snapshot
Treatment Area = 1,200 m2
Lithology = Clay with sand layers, 2-11 m below land surface(bls)/Sand aquifer, 11+ m bls
Depth to Water = 4-5 m bls
Contaminants = Gasoline range hydrocarbons, NAPL observed in soil
Implementation Method = Top-down direct push injection
Challenges & Objectives
The site challenges included: 1.) Injections were performed in the vicinity of an active un-manned gas station and large shopping center, 2.) work had to be timed accordingly to minimize or completely avoid any disturbance to the on-going retail operations
The objectives of the remedial action were: 1.) Meet specific soil and groundwater criteria both on site (within remediation area) and at specific compliance locations downstream of the treatment zone, 2.) Provide sufficient evidence through groundwater data that the remediation efforts were effective to allow for the construction of a new parking lot on top of the remediation area
RPI Group Approach
In 2015, a Remedial Design Characterization (RDC) was performed after a thorough data gap analysis was completed to assess the overall lateral and vertical extent of the soil contamination at the site (both unsaturated and saturated zones). First, a membrane interface probe (MIP) was advanced to delineate the plume (qualitatively). Secondly, 180 soil samples were collected within the contaminated area to estimate the total soil contaminant mass at the site. Soil samples were collected approximately every 50cm based on the information obtained from the MIP survey and were analyzed at the RPI Project Support Laboratory in Golden, CO pro bono.
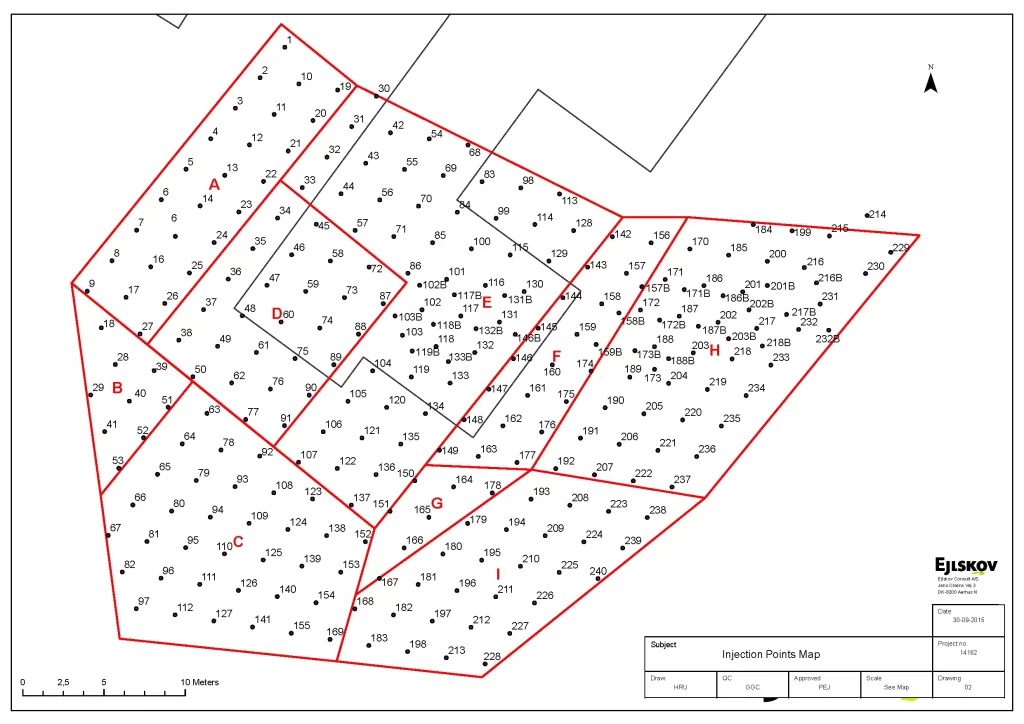
Based upon the MIP and RDC data, a 3D model was created to develop a surgical injection design (Figure 1).
Later in 2015, BOS 200® was installed via direct push injection into 267 injection locations (2.3 m spacing) between 4 and 13 m bls. Approximately 43,000 kg of BOS 200® and 22,500 kg of supplemental gypsum (additional sulfate source) were applied during the remedial effort.
Figure 1. Site Map with Surgical Injection Design
Results
Three monitoring wells within the remediation zone were demolished during the construction of the new parking lot. Due to site regrading, the first set of replacement wells were reinstalled about 6 months after the initial re-installation (Figure 2). Benzene concentrations in the replacement wells have been reduced 92.4-9-99.9% over the 4.5-year monitoring period.
Validation soil samples were collected three years post-injection to assess adsorbed mass concentration changes (Figure 3). In general, significant reductions were observed in the three borings advanced adjacent to RDC locations. Data from thirty-seven soil samples were compared to pre-injection data. Reductions were observed in thirty-three samples, increases were observed in two samples, and no concentration changes were observed in two samples.
The site was ready for the development into a parking lot within a few weeks following the completion of the fieldwork.
A reduction in groundwater monitoring activities was granted in June 2018 as a consequence of the positive results observed during the first 30 months post-injection.
Figure 2. Key Monitoring Well Benzene Concentrations v. TimeFigure 3. Pre and Post Remediation Benzene Concentrations in Soil