For nearly three decades, the Former Value Mart looked like a routine petroleum plume site. Monitoring wells installed across the site consistently reported elevated BTEX concentrations, reinforcing an assumption that groundwater defined both the problem and the solution.
From 2017 through 2020, benzene concentrations remained persistently elevated, showing no consistent decline. In one well, concentrations spiked to 124 mg/L, indicating active mass transfer. This pattern pointed to a continuing source, but groundwater data alone could not identify its location.
Earlier investigations had already provided clues. Soil borings encountered silty clay across the site, with strong petroleum odors and vapor readings exceeding 15,000 ppm, particularly between 10 and 18 feet below ground surface. However, these findings were not integrated into the conceptual model. High-resolution site characterization (HRSC) in 2020 changed that.
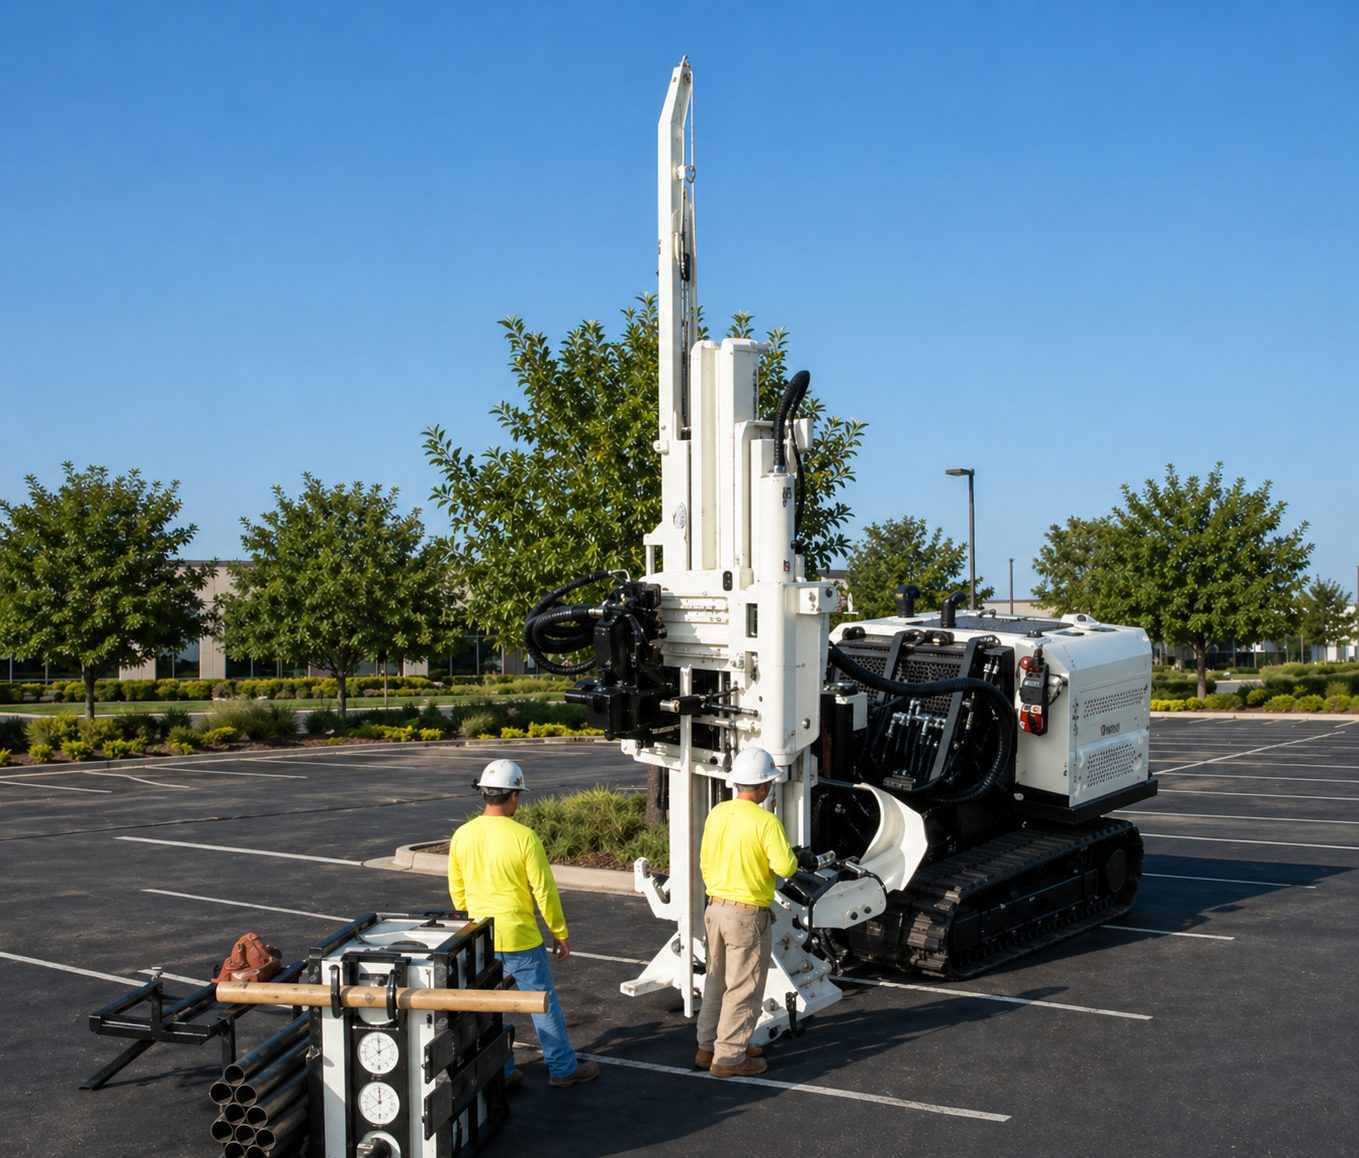
Using Membrane Interface Probe (MIP) and UVOST® fluorescence logging alongside Quantitative High-Resolution Site Characterization (qHSRC), investigators found that the bulk of the contaminant mass was not distributed as a plume but instead occurred in discrete, vertically separated zones in the soil. qHSRC consists of continuous vertical soil profiling and fixed-based laboratory analysis. Targeted soil samples collected from these intervals confirmed elevated BTEX concentrations in low-permeability clay, demonstrating that contaminant mass was retained in the subsurface soils.
Monitoring wells provided only discrete snapshots; MIP, UVOST, and qHSRC confirmed the concentration levels and identified the contaminated soil that housed the source driving the groundwater contamination. Approximately 50 cubic yards of LNAPL-impacted saturated soil* were identified.
With the conceptual model corrected and the contamination source identified, the remedy followed the data.
In August–September 2022, 20,000 pounds of activated-carbon-based BOS 200® were directly injected into the identified source zones. Unlike previous approaches, treatment was placed directly into the immobile source mass rather than targeting the groundwater plume.
The system responded immediately. Post-injection monitoring showed orders-of-magnitude reductions in BTEX concentrations across the site, with values declining from mg/L to near-detection limits.
The takeaway is simple:
Groundwater data showed the symptoms—but not the cause. Applying multiple site characterization tools and quantifying the identified mass with qHSRC enabled direct injection of BOS 200® into the source mass.
The source was always there. It just needed to be clearly delineated.
*In this context, soils refer to aquifer solids (the soil and sediment matrix surrounding groundwater).