

Key differences exist between activated carbon-based in situ remediation technologies such as BOS 200® and colloidal activated carbon (CAC). These differences include remedial efficiency, applicable groundwater and soil concentration ranges, application technique, particle size, bacterial and nutrient co-injection, and selection of terminal electron acceptors.
BOS 200® and BOS 200+® are complete in situ remediation systems that incorporate powdered activated carbon, electron acceptors, micro- and macronutrients, and a blend of facultative bacteria. CACs typically lack key nutrients and beneficial bacteria, although specific deficiencies vary by product.
This Technical Bulletin outlines the differences between CAC and BOS 200, enabling environmental practitioners to select the appropriate technology that meets project objectives and client expectations.
Last Updated: July 20, 2026
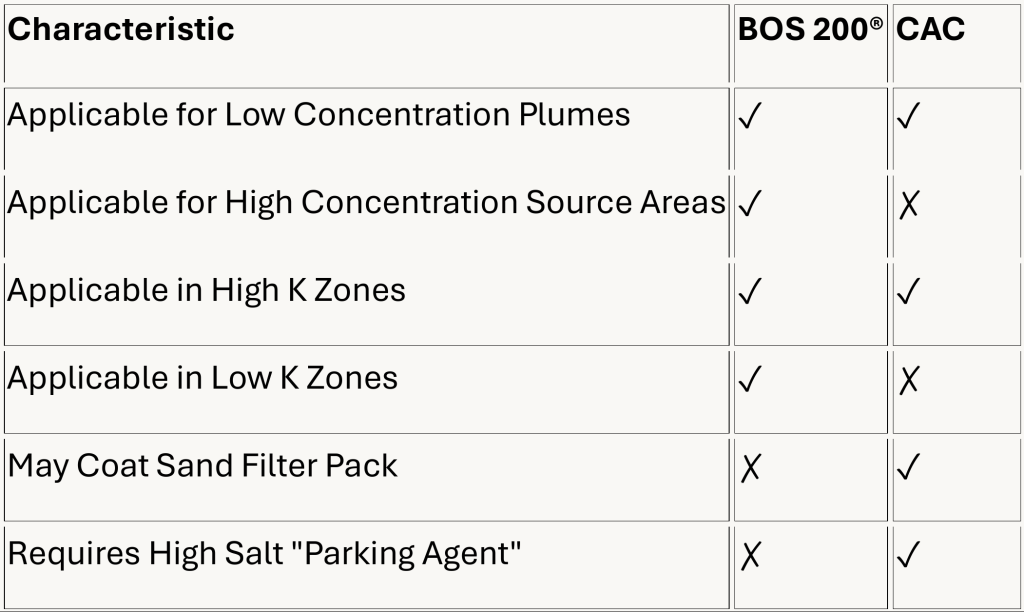
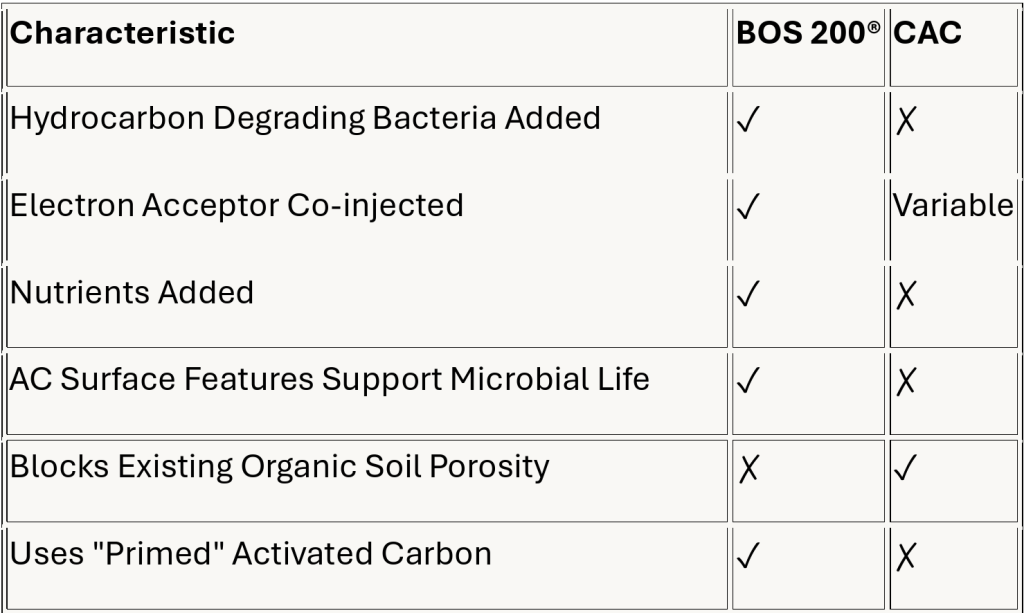
Significant differences exist between CAC and BOS 200 technologies regarding treatable contaminant concentrations.
The CAC approach is limited by the amount of activated carbon that can exist in solution. Aggregation of particles in colloidal systems has been studied extensively across various industries. Determining particle concentration requires trade-offs:
When significant particle aggregation occurs, the average particle size exceeds the intended colloidal range, negating the value of colloidal-sized particles.
To facilitate activated carbon loading and reduce particle aggregation, all colloidal activated carbon products use dispersants. The dispersant influences loading, distribution, formation interactions, bioremediation rate, and sustainability. Project managers should carefully consider dispersant characteristics when evaluating colloidal products.
The rate at which colloidal carbon agglomerates and affixes to the formation depends on the dispersant employed (Haupt, 2019) and installation technique. Therefore, CAC technologies are limited to polishing and/or dissolved-phase treatment due to the incompatibility of colloidal suspensions and high carbon loading.
In contrast, BOS 200 successfully treats across the concentration spectrum from polishing to LNAPL treatment. Case studies for BOS 200 source area applications can be found at:
The choice of material from which activated carbon is made significantly affects its adsorption characteristics (Zango et al., 2020). Despite being rich in binding pores (micropores), coconut-based AC exhibits slower kinetic adsorption due to relatively fewer transport pores or mesopores (McNamara et al., 2018).
Coconut shell carbons are less expensive and easier to mill to colloidal size, but coconut carbon does not bioregenerate as well as wood-based (Piai et al., 2019) or coal-based activated carbons (Zhang et al., 2013). Based on bioregeneration alone, coconut carbon requires a 20-30% increase in loading relative to coal-based carbon.
Additionally, coconut carbon has lower adsorption capacity for petroleum hydrocarbons across molecular weights compared to coal-based activated carbons, although it performs slightly better at adsorbing low molecular weight aromatics.
CAC and BOS 200 are applied to the subsurface using significantly different methods.
An advertised strength of CAC is that it can be applied using low flow rates and low-pressure conditions without specialized equipment. However:
After numerous failures to distribute CAC using low pressure, CAC installers have begun employing high-pressure injection. However, this negates the core selling point that highpressure equipment is unnecessary. If high-pressure equipment is required, there is no added value to grinding activated carbon to 1-2 µm. The small particle size becomes incompatible with high mass activated carbon loading, and the dispersant facilitates uncontrolled dispersion, potentially requiring salt solution injection to address dispersion issues.
BOS 200 is installed using high-energy emplacement methods tuned to lithology:
Coarse-grained aquifers:
Fine-grained aquifers:
BOS 200 is installed as a slurry. When active injection ceases, product movement stops as pressure bleeds off, and BOS 200 remains emplaced in the stratigraphy. BOS 200 does not move once emplaced.
CAC coats sand particles in monitoring well filter packs (see Images 1A and 1B below). Once CAC coats the filter pack, monitoring wells fail to accurately characterize groundwater contaminant concentrations, as contaminants are lost to the CAC-coated filter pack. Additionally, colloidal particles pass through pore spaces and enter monitoring wells. Given the small size of CAC particles, monitoring wells cannot be rehabilitated solely by cleaning.
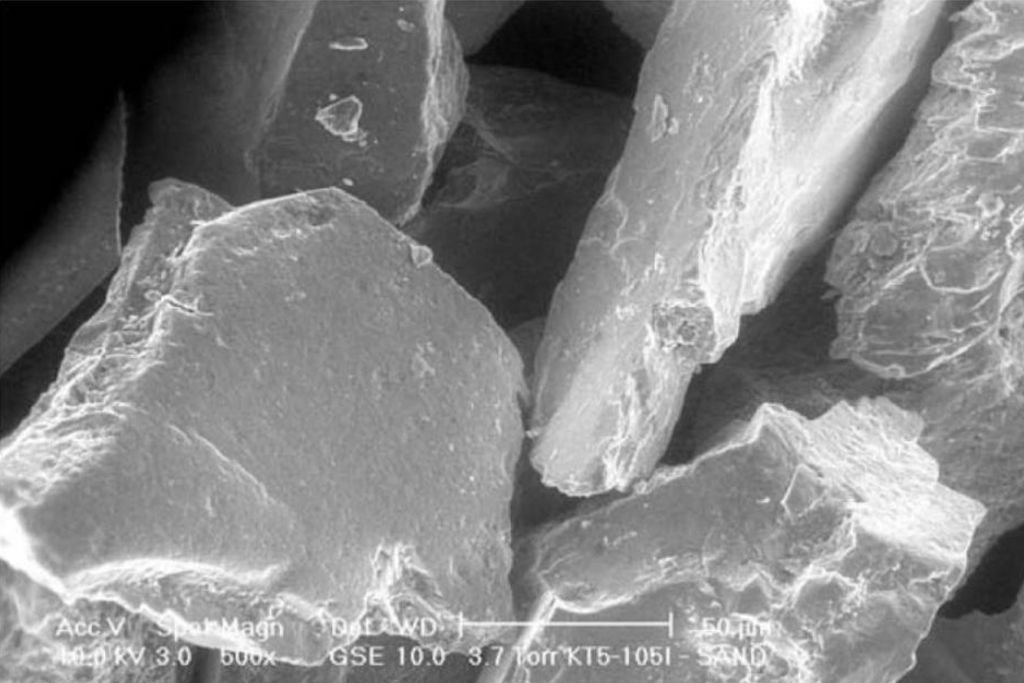
Scanning electron microscope (SEM) image of sand particles without CAC coating.
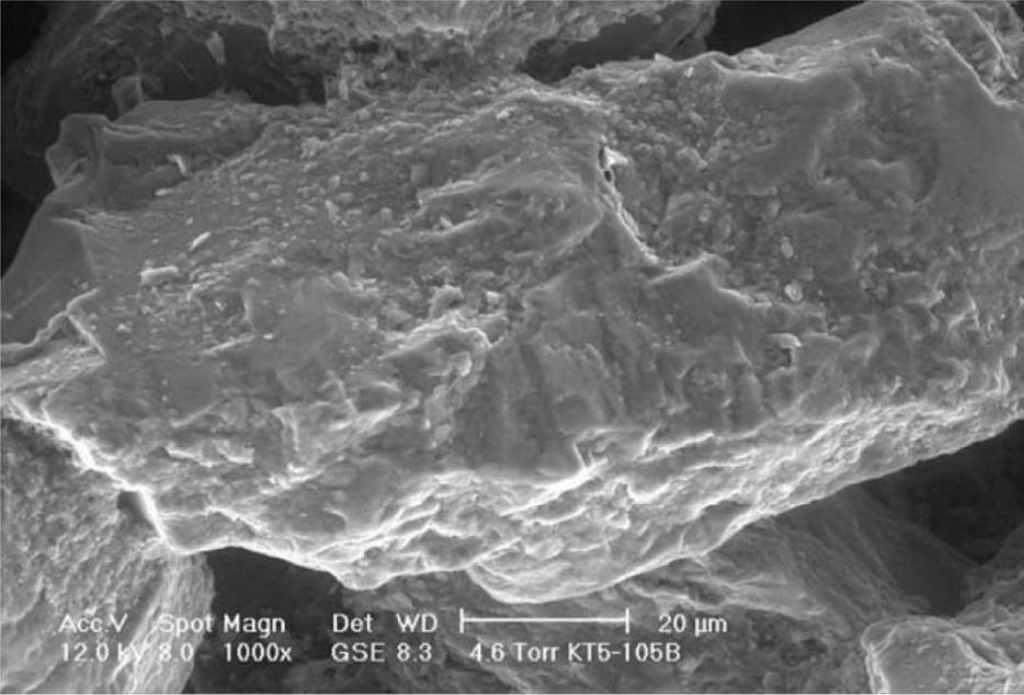
Scanning electron microscope (SEM) image of sand particles with CAC coating. The coating appears as particles in the sub-micron to 3 μm range. Compare the sand grains in Image 1A to Image 1B and note the rough surface from colloidal carbon attachment. Sand grains in a fine 20/40 mesh sand pack have an effective pore diameter of 85-170 μm. Colloidal particles can pass through the pore space (images from Haupt 2019).
One CAC company’s literature claims that groundwater samples can be sent to the laboratory for contaminant analysis when you can see through a 40-mL VOA vial. They write that when you can see through the vial that corresponding to approximately 100 mg/L or less suspended CAC (Regenesis 2022).
The RPI Laboratory tested this claim by adding CAC to vials containing 50 ppb of p-Bromo fluorobenzene. The relative percent change between the blank without CAC and the 100 ppm CAC sample was 53.8%. Being approximately 50% wrong is not trivial for analytical results. See Table 1. You may be able to see through a vial containing CAC, but that does not mean your analytical results are accurate.
The data demonstrate the interference effect of colloidal activated carbon (CAC) on the GC/MS analysis of p-Bromofluorobenzene. There is a clear inverse correlation between CAC concentration and analyte recovery, with recovery decreasing from 64.72% in the blank to 29.92% at a CAC concentration of 100 ppm.
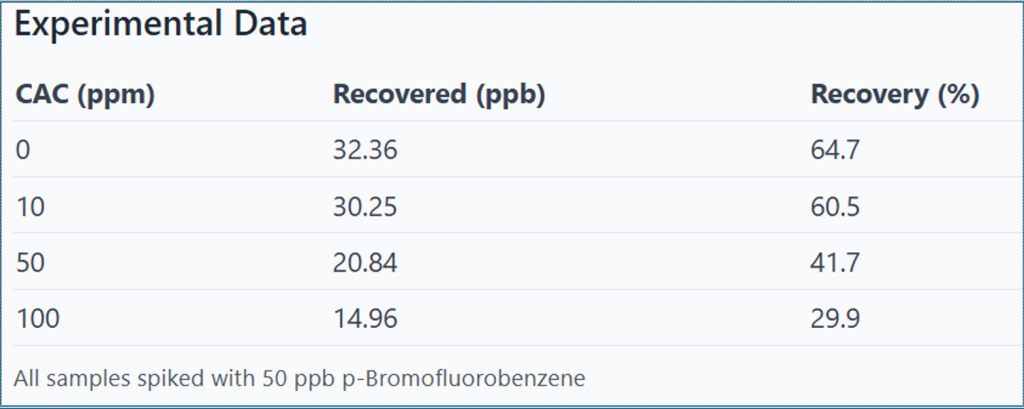
Table 1. This data demonstrates that CAC particles adsorb the benzene compound, reducing the amount available for detection and leading to underestimation of contaminant concentrations in environmental samples containing CAC.
Using methods developed within the RPI Group, BOS 200 can be cleaned out of monitoring wells in most cases.
CAC lacks significant surface fractures and macropores because they are removed by the milling process used to make particles “colloidal” sized. BOS 200 particles average 24 µm in diameter, while CAC particles average 2 μm in diameter. This size difference impacts both biodegradation and adsorption.
Activated carbon installed in the subsurface becomes a habitat for microorganisms. Bacteria range in size from approximately 1 to 5μm—meaning microbes are on average larger than individual CAC particles. Bacteria are simply too large to inhabit CAC particles. In contrast, bacteria can and do inhabit the macropores and surface features of BOS 200, making it an efficient platform for biological treatment.
Performance Implications:
CAC is inappropriate for permeable reactive barriers. While marketed as able to move into permeable zones, this mobility is undesirable for PRB installations where activated carbon must remain embedded in the desired zone to reduce mass flux. The inability of colloidal-sized particles to remain suspended without dispersants affects PRBs because colloidal carbon moves. Various salts (parking solutions) are injected to drive CAC out of solution, but the impact of these salts on remedial efficiency has not been studied.
CAC technologies do not generally prime activated carbon or co-inject microbes. This approach may subject CAC to rollover due to failure to provide a consistent treatment mechanism. Without a degradation mechanism, other contaminants or organic carbon can desorb the sorbed contaminants, as chemicals with higher heats of adsorption displace those with lower heats of adsorption.
BOS 200 is applied as a complete remediation system including a blend of facultative bacteria. Bacteria are added to the mix tank prior to application to prime the activated carbon. Priming activated carbon is fundamental to forming biologically active carbon and stimulates bioremediation processes from day zero. Waiting for indigenous bacteria to inhabit carbon delays degradation, and degradation may not proceed efficiently if formation bacteria cannot degrade the full range of hydrocarbons.
Robust microbial degradation occurs only when microbes are provided with an environment favorable to growth and reproduction. Just as humans need oxygen as an electron acceptor in metabolic processes, microbes need electron acceptors to sustain their metabolic processes.
CAC products, depending on the specific product, may be combined with:
Oxygenates are only cost-effective when contamination levels are trivial enough for microbial destruction of the contamination to occur before the oxygenate is depleted, or when aquifers can maintain sufficient oxygenation after supplied oxygenate is exhausted. Most oxygen-releasing compounds are active for about six months in high-seepage velocity aquifers.
Most petroleum-contaminated aquifers are anaerobic because microbial metabolic activities consume available oxygen early in hydrocarbon releases. Therefore, some CAC products provide electron acceptors such as sulfate, recognizing that changing an aquifer’s oxygen status is challenging.
BOS 200 provides appropriate electron acceptors, nutrients, and facultative bacteria to establish an optimal environment supporting both aerobic and anaerobic degradation. Recognizing that most hydrocarbon contamination is likely degraded anaerobically, BOS 200 is designed to provide long-term electron acceptors. Electron acceptors are not just another add on, with BOS 200 electron acceptors are included.
RPI employs activated carbon as a platform and catalyst for remediation as part of a comprehensive approach. Activated carbon constitutes a significant portion of all carbon-based product costs, making cost comparison relevant.
One pound of CAC contains roughly: 454 gms x 0.25 = 113.5 gms carbon.
One pound of BOS 200+ contains 454 gms x 0.615 = 279.2 gms carbon.
BOS 200+ contains (279.2/113.5)x 100 = 246% more activated carbon.
A popular CAC product costs approximately $4.25 per pound but contains 68% water. If CAC sells for $4.25 per pound and contains only 32% dry ingredients, then the cost of dry ingredients is $4.25 ÷ 0.32 = approximately $13.28 per pound.
In contrast, BOS 200 and 200+ are dry products requiring no mathematical calculations— they remain $4.25 per pound.
On a dry weight basis, CAC costs over three times that of BOS 200+!
El Gamal, M., Mousa, H. A., El-Naas, M. H., et al. (2018). Bio-regeneration of activated carbon: A comprehensive review. Separation and Purification Technology, 197, 345-359.
Fredrickson, J. K., McKinley, J. P., Bjornstad, B. N., Long, P. E., Ringelberg, D. B., White, D. C., Krumholz, L. R., Suflita, J. M., Colwell, F. S., Lehman, R. M., Phelps, T. J., & Onstott, T. C. (1997). Pore‐size constraints on the activity and survival of subsurface bacteria in a late cretaceous shale‐sandstone sequence, northwestern New Mexico. Geomicrobiology Journal, 14(3), 183-202.
Haupt, S. J. (2019). Migration of Chlorinated solvent groundwater plumes with colloidal activated carbon [Master’s thesis, University of Rhode Island]. URI Digital Commons.
Liang, C. H., Chiang, P. C., & Chang, E. E. (2007). Modeling the behaviors of adsorption and biodegradation in biological activated carbon filters. Water Research, 41(15), 3241-3250.
McNamara, J. D., Franco, R., Mimna, R., & Zappa, L. (2018). Comparison of Activated Carbons for Removal of Perfluorinated Compounds from Drinking Water. Journal of AWWA, 110(1), E2-E14.
Piai, L., Dykstra, J. E., Adishakti, M. G., Blokland, M., Langenhoff, A. A. M., & van der Wal, A. (2019). Diffusion of hydrophilic organic micropollutants in granular activated carbon. Water Research, 162, 518-527.
Rattier, M., Reungoat, J., Gernjak, W., & Keller, J. (2012). Organic Micropollutant Removal by Biological Activated Carbon Filtration: A Review. Urban Water Security Research Alliance.
Regenesis. (2022). Colloidal Suspension Sampling Guidance Document. Retrieved September 20, 2025, from https://regenesis.com/wp-content/uploads/2019/12/ColloidalSuspension-Sampling-Guidance-Document-4122022-v9.pdf
Santamarina, V. R-L, Carlos, J. (2006). Mechanical limits to microbial activity in deep sediments. Geochemistry, Geophysics, Geosystems, 7(11).
Wang, G., & Or, D. (2010). Aqueous films limit bacterial cell motility and colony expansion on partially saturated rough surfaces. Environmental Microbiology, 12(5), 1363-1373.
Zango, Z. U., Sambudi, N. S., Jumbri, K., Ramli, A., Abu Bakar, N. H. H., Saad, B., Rozaini, M. N. H., Isiyaka, H. A., Osman, A. M., & Sulieman, A. (2020). An overview and evaluation of highly porous adsorbent materials for polycyclic aromatic hydrocarbons and phenols removal from wastewater. Water, 12(10), 2921.
Zhang, W., Ding, W., & Ying, W. (2013). Biological Activated Carbon Treatment for Removing BTEX from Groundwater. Journal of Environmental Engineering, 139(10), 1246-1254.